A drawing and editing layer that plugs into your map.

Add a map data editor to your app.

Element Editor is a map drawing and GeoJSON editing library for React: users draw, edit and attach data to shapes on MapLibre or Leaflet maps. Open source. MIT licensed. Free for any use.

Read the docs

MIT-licensed · React 19.2 · MapLibre out of the box, or plug into Leaflet or any map SDK

Need more room? Take the editor full screen.

How do you want to use it?

React

@element-editor/react

Drop in one component. Element owns the MapLibre map, the basemaps, the toolbar, and all editor state.

For: Apps that want a full map editor without assembling the pieces.

Quickstart
npm install @element-editor/react maplibre-gl
import { ElementEditor } from '@element-editor/react'
import '@element-editor/react/style.css'

export default function App() {
  return (
    <div style={{ width: '100%', height: '600px' }}>
      <ElementEditor onChange={(data) => console.log(data)} />
    </div>
  )
}
Leaflet

@element-editor/adapter-leaflet

Add editing to an existing Leaflet or react-leaflet map. Your map stays yours.

For: Apps that already have a Leaflet map and need an editing layer on top.

Quickstart
npm install @element-editor/adapter-leaflet @element-editor/ui leaflet react-leaflet
import { MapContainer, TileLayer } from 'react-leaflet'
import { ElementEditorUIProvider, GeoStoreProvider, ElementEditorControls } from '@element-editor/adapter-leaflet'
import '@element-editor/adapter-leaflet/style.css'

<ElementEditorUIProvider>
  <GeoStoreProvider>
    <div data-elm-theme="light" style={{ position: 'relative', width: '100%', height: '600px' }}>
      <MapContainer center={[48.86, 2.35]} zoom={5} style={{ width: '100%', height: '100%' }}>
        <TileLayer url="https://tile.openstreetmap.org/{z}/{x}/{y}.png" attribution="&copy; OpenStreetMap contributors" />
        <ElementEditorControls onChange={(data) => console.log(data)} />
      </MapContainer>
    </div>
  </GeoStoreProvider>
</ElementEditorUIProvider>

MapLibre

@element-editor/adapter-maplibre

Add editing to an existing MapLibre GL, MapTiler SDK, or Mapbox GL JS map.

For: Apps built on vector tiles that want editing without switching engines.

Quickstart
npm install @element-editor/adapter-maplibre @element-editor/ui maplibre-gl
import { ElementEditorUIProvider, GeoStoreProvider, ElementEditorControls } from '@element-editor/adapter-maplibre'
import 'maplibre-gl/dist/maplibre-gl.css'
import '@element-editor/adapter-maplibre/style.css'

// containerRef, mapRef, mapReady: create the map in a useEffect (see quickstart)
<ElementEditorUIProvider>
  <GeoStoreProvider>
    <div data-elm-theme="light" style={{ position: 'relative', width: '100%', height: '600px' }}>
      <div ref={containerRef} style={{ width: '100%', height: '100%' }} />
      {mapReady && mapRef.current && (
        <ElementEditorControls map={mapRef.current} onChange={(data) => console.log(data)} />
      )}
    </div>
  </GeoStoreProvider>
</ElementEditorUIProvider>

Not sure which one fits? Answer three questions and get a recommendation, or set up your editor visually and copy the ready-made code.

Everything you’d build yourself, already built.

Everything below is in the community edition, free under MIT.

What you won't find in Geoman, Leaflet.Draw, or Mapbox GL Draw.

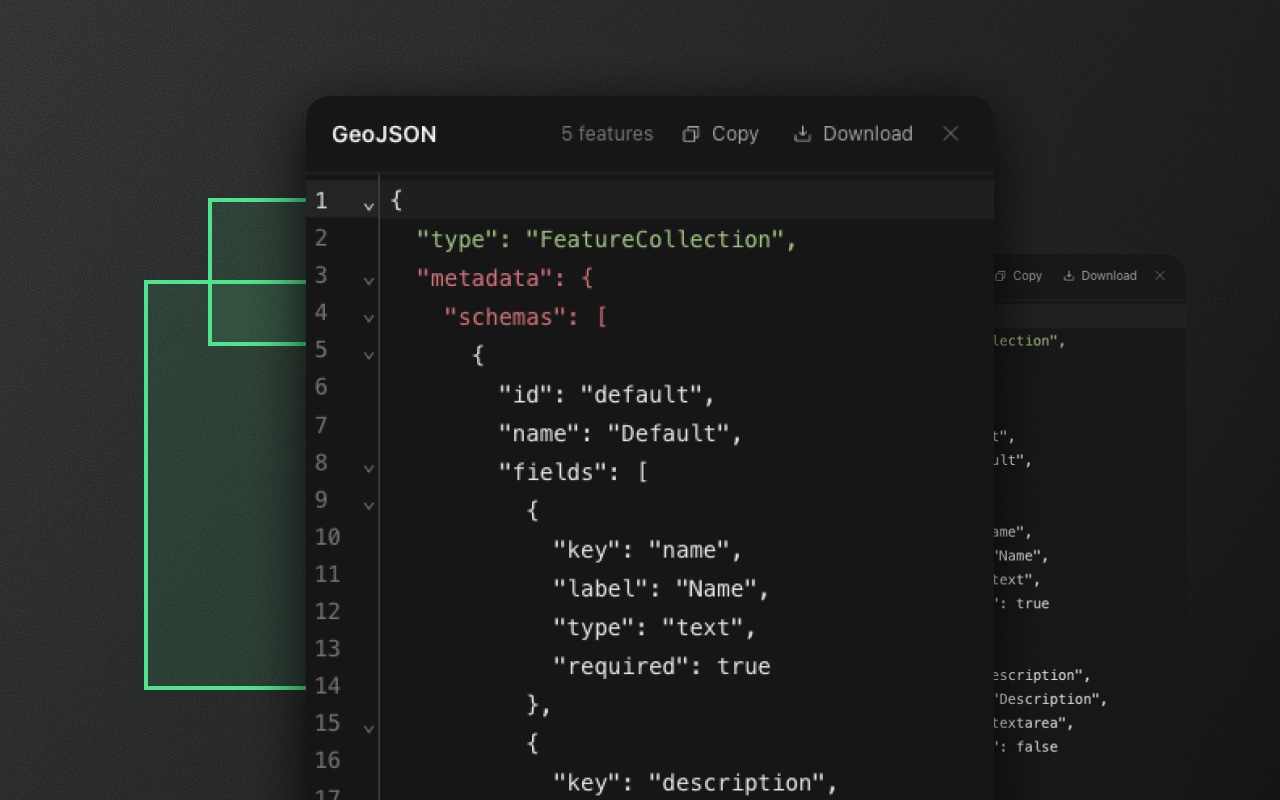
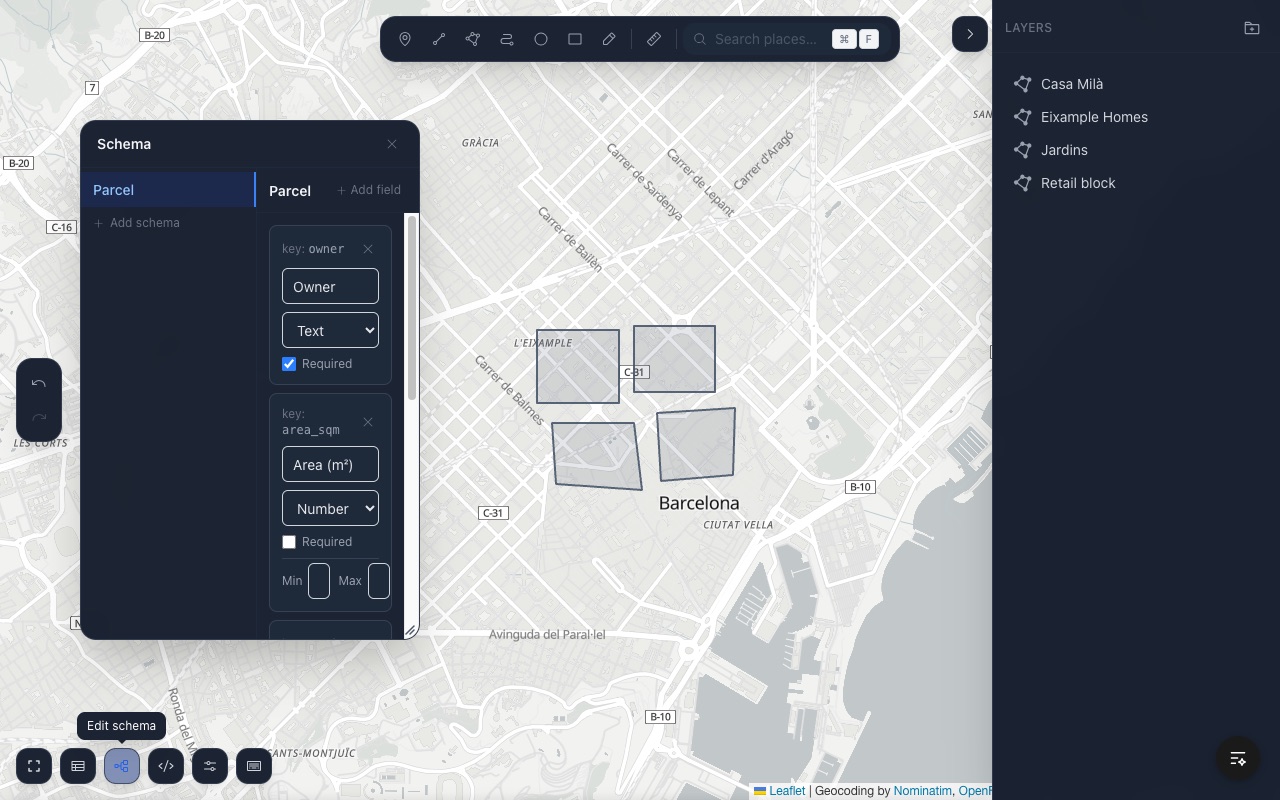
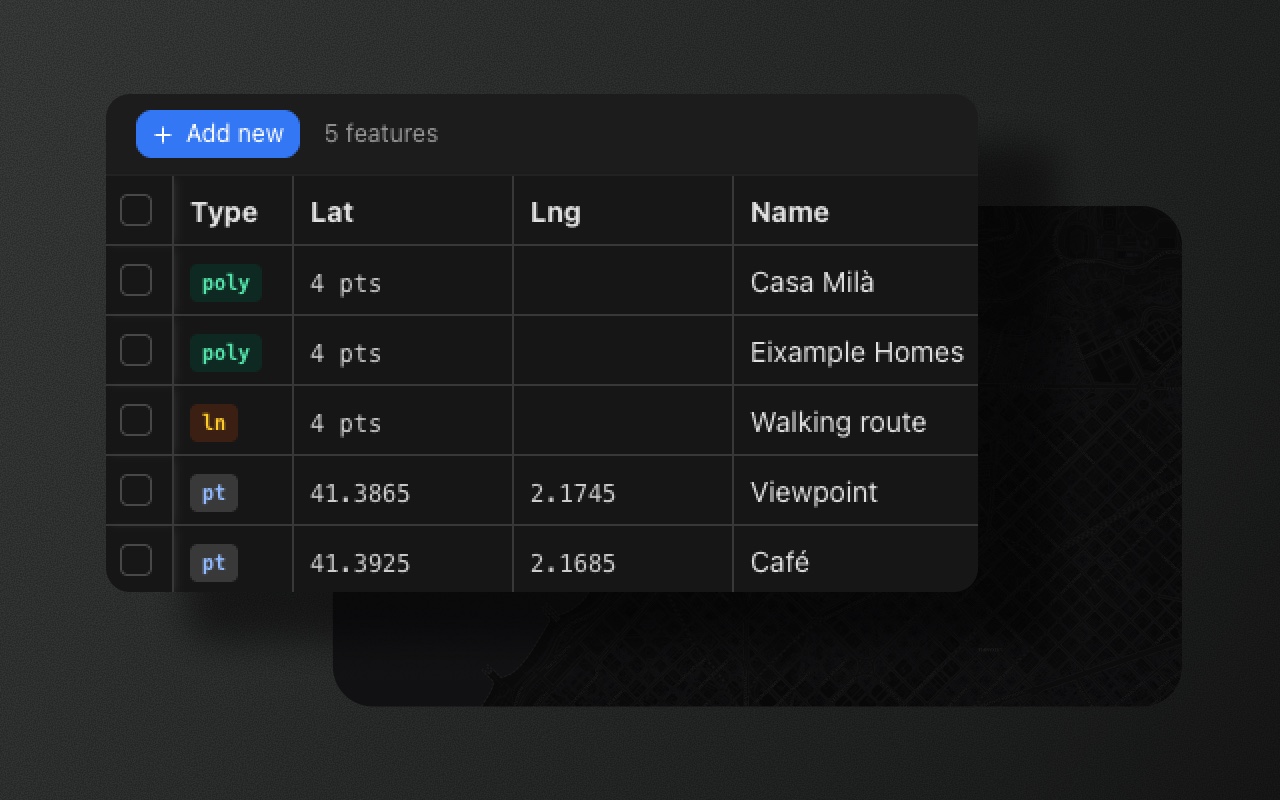
Most map editors stop at geometry. Element ships the data side too: typed properties, a table to edit them, and the raw GeoJSON, all inside the editor, so you don't build that tooling yourself.

  • Most map libraries draw shapes. The data side is a bag of untyped properties you have to clean up in your backend.

    Element adds a schema layer: named, typed fields — text, textarea, number, URL, select, date, boolean — with optional validation. Draw a shape, fill in a real form, get back GeoJSON with structured properties.

    Schemas export with the data and import back intact. Define them in code, or edit them in-app with the schema editor.

    Learn moreSchemas define the form. The form generates from the schema.

Built for big datasets.

Pan, zoom, select and drag across 5,000 features at a median 60 fps, and reshape a single 50,000-point boundary, without the page freezing. Measured on both Leaflet and MapLibre, not estimated.

How we measured

Works with your stack.

Sensible basemaps out of the box, and no lock-in: swap in any tile provider. No routing opinions. No state management opinions. Element is the editing layer — bring everything else.

Features exit as RFC 7946 GeoJSON. Your backend, database, and analytics pipeline don't need to change.

Open source at the core. Pro for teams.

Every capability that ships today is MIT licensed and free, including for commercial use. Pro will be a future team tier of add-ons, not a paywall on what's already free. Compare tiers

Community

MIT licensed. Free for any use, including commercial.

  • Every package — React, Leaflet, MapLibre / Mapbox / MapTiler
  • Every drawing tool, with vertex editing, selection, and transform
  • Boolean operations, geometry processing, and measure
  • Typed schemas, a data table, and a two-way GeoJSON editor
  • Import and export GeoJSON — paste, file, or drag and drop
  • Light, dark, and auto theming, with remappable shortcuts
  • Community support via GitHub Discussions
Get started

Pro

Coming soon. Team-oriented extensions on top of the open-source core.

  • Everything in Community
  • Real-time collaborative editing
  • Advanced data visualization layers
  • Charts and analytics on your feature collections
  • Feedback and comments pinned to features on the map
  • AI assistant that edits and queries your map data through MCP
  • Forms that collect geospatial data from anyone, no editor needed
  • Priority support
Get in touch

Built on standards. No lock-in.

Everything you draw is saved as standard GeoJSON, the format map libraries, spatial databases, and GIS tools already read. Coordinates are plain longitude and latitude. A route is an ordinary line. A circle is stored as a polygon with a small extra field, so Element can reopen it as a circle while other tools simply see a polygon. Remove Element at any time and your data keeps working everywhere else.

What is GeoJSON? · The GeoJSON spec (RFC 7946) ↗

Start with the docs.

Built for developers who ship.

Start in the playground. Finish in production.

Open the playground → · Read the quickstart · View on GitHub ↗